PERCEPTION and Data Visualization: Concepts, Examples, Code, Projects

PERCEPTION

Data Visualization for Human Perception
"Data visualization is the graphical display of abstract information for two purposes: sense-making (also called data analysis) and communication. … In other words, to visualize data effectively, we must follow design principles that are derived from an understanding of human perception."
https://www.interaction-design.org/literature/book/the-encyclopedia-of-human-computer-interaction-2nd-ed/data-visualization-for-human-perception

The Role of Visual Perception in Data Visualization
https://www.sciencedirect.com/science/article/pii/S1045926X02902351

Pre-attentive Processing
https://www.alleydog.com/glossary/definition.php?term=Preattentive%2520Processing

3 Expert Data Visualization Tips for Grabbing Readers’ Attention
Read more at https://visme.co/blog/data-visualization-tips/#lxVeLRMe1wybkjdE.99
https://visme.co/blog/data-visualization-tips/

Attention and Visual Memory in Visualization and Computer Graphics
https://www.csc2.ncsu.edu/faculty/healey/download/tvcg.11.pdf

Preattentive Visual Properties and How to Use Them in Information Visualization
https://www.interaction-design.org/literature/article/preattentive-visual-properties-and-how-to-use-them-in-information-visualization

Choosing Colors for Data Visualization
http://www.b-eye-network.com/newsletters/ben/2235

Exploring Preattentive Attributes (Beta)
https://learnforeverlearn.com/preattentive/

Perception
http://www.ifs.tuwien.ac.at/~silvia/wien/vu-infovis/articles/03_Perception.pdf

Color value refers to the lightness or darkness of the hue. … Adding black to a hue produces a low-value color, often called a shade. Intensity. Intensity, also called chroma or saturation, refers to the brightness of a color.

Elements of Design: Value & Color
https://etad.usask.ca/skaalid/theory/cgdt/color.htm

Color in Visualization
https://www.ics.uci.edu/~majumder/vispercep/colviz.pdf

Colors as Hue, Saturation and Brightness
http://www.georeference.org/doc/colors_as_hue_saturation_and_brightness.htm

Choosing colors for your data visualization
https://cambridge-intelligence.com/choosing-colors-for-your-data-visualization/

Perception in Visualization
https://www.csc2.ncsu.edu/faculty/healey/PP/index.html

Target detection in scientific visualization
https://psycnet.apa.org/record/2001-00202-002
Check here as well: https://www.csc2.ncsu.edu/faculty/healey/PP/index.html

Object detection via color-based image segmentation using python
https://towardsdatascience.com/object-detection-via-color-based-image-segmentation-using-python-e9b7c72f0e11
Check here as well: https://www.csc2.ncsu.edu/faculty/healey/PP/index.html

A systematic comparison between visual cues for boundary detection
https://www.sciencedirect.com/science/article/pii/S0042698915003685
Check here as well: https://www.csc2.ncsu.edu/faculty/healey/PP/index.html

Perception and Boundary Detection
https://cslu.ohsu.edu/~bedricks/courses/conj_610/pdf/lec_2_part_2.pdf

Why rainbow colors aren’t the best option for data visualizations
https://www.poynter.org/archive/2013/why-rainbow-colors-arent-always-the-best-options-for-data-visualizations/

Color and Counting
Find on: http://www.ifs.tuwien.ac.at/~silvia/wien/vu-infovis/articles/03_Perception.pdf

Color and Perception
https://makingmaps.net/2007/08/28/perceptual-scaling-of-map-symbols/

Color Blindness by Inheritance
https://www.colour-blindness.com/general/prevalence/

Form and Color. Form and Boundary Detections
Find on: https://cslu.ohsu.edu/~bedricks/courses/conj_610/pdf/lec_2_part_2.pdf
Find on: http://www.ifs.tuwien.ac.at/~silvia/wien/vu-infovis/articles/03_Perception.pdf

Perceptual Scaling
Perceptual Scaling of Map Symbols
https://makingmaps.net/2007/08/28/perceptual-scaling-of-map-symbols/

MAJOR CITIES OF INDIA: PERCEPTUAL VS. ABSOLUTE SCALING
https://blogs.ubc.ca/katerynabaranovasgis/tag/perceptual-scaling/

Ebbinghaus illusion
https://en.wikipedia.org/wiki/Ebbinghaus_illusion
https://en.wikipedia.org/wiki/Ebbinghaus_illusion#/media/File:Mond-vergleich.svg

Flicker, Motion for Preattentive
https://www.csc2.ncsu.edu/faculty/healey/PP/
https://learnforeverlearn.com/preattentive/

Principles of Data Visualization
http://saravanan-thirumuruganathan.github.io/cse5334Spring2015/slides/03_PrinciplesOfViz/03_PrinciplesOfViz_final.pdf

Humans Detect Patterns
http://www.mrc-cbu.cam.ac.uk/people/matt-davis/cmabridge/
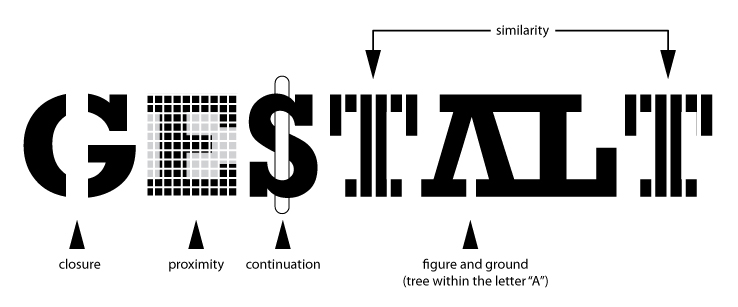
Gestalt Principles
https://www.interaction-design.org/literature/topics/gestalt-principles

Principles of grouping. Similarity, Closure
https://en.wikipedia.org/wiki/Principles_of_grouping

Symmetry:Gestalt Principles:Simplicity, symmetry and more: Gestalt theory and the design principles it gave birth to
https://www.canva.com/learn/gestalt-theory/

Continuity:
find on: https://cslu.ohsu.edu/~bedricks/courses/conj_610/pdf/lec_2_part_2.pdf
https://www.freepik.com/free-icon/olympic-games-logo_733186.htm

Misc
https://d3ui957tjb5bqd.cloudfront.net/uploads/2016/03/Gestalt-Psychology-.jpg

Projects

Will be added later in this article or in separate posts

Sayed Ahmed

Linkedin: https://ca.linkedin.com/in/sayedjustetc

Blog: http://sitestree.com, http://bangla.salearningschool.com

Text Visualization: Concepts, Examples, Code (Python, R, Matlab), Example Projects

Text Visualization

Data Visualization Of President Obama’s Inauguration Speech
https://blog.capitalogix.com/public/2009/01/data-visualization-of-president-obamas-inauguration-speech.html

Text Visualization Course at Washington University
https://courses.cs.washington.edu/courses/cse512/16sp/lectures/CSE512-Text.pdf

Why Visualize Text?
https://www.teachervision.com/reading-comprehension/visualizing

You can visualize text to find key concepts in a speech.
Obama’s Speech: https://www.nytimes.com/2009/09/10/us/politics/10obama.text.html

Example: Speech/Article Visualizations
https://economix.blogs.nytimes.com/2009/09/09/obama-in-09-vs-clinton-in-93/?mtrref=undefined&gwh=EA5A091DC9E658A2DCC9513805FEAC3F&gwt=pay&assetType=REGIWALL

1993 Speech: Bill Clinton
https://economix.blogs.nytimes.com/2009/09/09/bill-clinton-on-health-care-1993/
1993 vs 2009. https://economix.blogs.nytimes.com/2009/09/09/obama-in-09-vs-clinton-in-93/

Wordtree
https://www.jasondavies.com/wordtree/?source=8bd3e76f64f2d614410435434e2fb1fd&prefix

Text Visualization Overview
https://courses.cs.washington.edu/courses/cse512/16sp/lectures/CSE512-Text.pdf

Introduction to Text Analysis: Cleaning/Parsing
http://guides.library.duke.edu/c.php?g=289707&p=1930855

Tokenization
https://graphics.cs.wisc.edu/WP/vep/tokenization/

Wordcount
http://www.wordcount.org/main.php

Wordcloud
https://www.jasondavies.com/wordcloud/

See through your text
https://voyant-tools.org/

Bubble Cloud
http://vallandingham.me/bubble_cloud/?sherlock

Comparison Cloud: Comparative Word Cloud
https://sites.google.com/site/miningtwitter/questions/talking-about/wordclouds/comparison-cloud

N-Grams
http://text-analytics101.rxnlp.com/2014/11/what-are-n-grams.html

Wordtree
https://developers.google.com/chart/interactive/docs/gallery/wordtree

Pattern Searching using Suffix Tree
https://www.geeksforgeeks.org/pattern-searching-using-suffix-tree/

Wordtree
https://www.jasondavies.com/wordtree/

Clustered Word Cloud
http://neoformix.com/2011/WordClusterDiagram.html

Document Contrast Diagrams
http://neoformix.com/2008/DocumentContrastDiagrams.html

Phrase Net
https://www.betterevaluation.org/en/evaluation-options/phrase_net

Analyze Obama’s Speech from 2004: Code Example
https://hackernoon.com/analysing-obama-speeches-since-2004-7f08797f7078

A Complete Exploratory Data Analysis and Visualization for Text Data
https://towardsdatascience.com/a-complete-exploratory-data-analysis-and-visualization-for-text-data-29fb1b96fb6a

Basics of Text Analysis & Visualization
https://itnext.io/basics-of-text-analysis-visualization-1978de48af47

The Data Visualization Design Process: A Step-by-Step Guide for Beginners
https://depictdatastudio.com/data-visualization-design-process-step-by-step-guide-for-beginners/

Wordnet Visualization
http://vialab.science.uoit.ca/portfolio/wordnet-visualization

Visual Wordnet with D3JS
https://www.visual-thesaurus.com/wordnet.php

Visualizing Word Vectors with t-SNE
https://www.kaggle.com/jeffd23/visualizing-word-vectors-with-t-sne

Embedding Projector
https://projector.tensorflow.org/

Visualizing Tweets with Word2Vec and t-SNE, in Python
https://leightley.com/visualizing-tweets-with-word2vec-and-t-sne-in-python/

Text Analysis for Visualizations
http://vallandingham.me/textvis-talk/#1

visualization-and-sentiment-analysis
https://www.kaggle.com/shaliniyaramada/visualization-and-sentiment-analysis

Word Cloud. Bag of Words
https://www.mathworks.com/help/textanalytics/ref/ldamodel.wordcloud.html

Sayed Ahmed

Linkedin: https://ca.linkedin.com/in/sayedjustetc

Blog: http://sitestree.com, http://bangla.salearningschool.com

Time Series: Concepts, Visualizations, Example Code, Example Projects

Time Series: Concepts, Visualizations, Example Code, Example Projects


What is Time Series
https://en.wikipedia.org/wiki/Time_series

A comprehensive beginner’s guide to create a Time Series Forecast (with Codes in Python and R)
https://www.analyticsvidhya.com/blog/2016/02/time-series-forecasting-codes-python/


A Complete Tutorial on Time Series Modeling in R
https://www.analyticsvidhya.com/blog/2015/12/complete-tutorial-time-series-modeling/


Creating Time Series Forecast using Python
https://courses.analyticsvidhya.com/courses/creating-time-series-forecast-using-python?utm_source=blog&utm_medium=TimeSeriesForecastComprehensivearticle


6.4.1. Definitions, Applications and Techniques
https://www.itl.nist.gov/div898/handbook/pmc/section4/pmc41.htm


Forecast and Trend
https://www.excel-easy.com/examples/forecast-trend.html


Time Series Analysis: Seasonality
http://slideplayer.com/slide/1507153/


Cyclic and seasonal time series
https://robjhyndman.com/hyndsight/cyclicts/


Time Series and Forecasting
https://www.slideshare.net/bmcfad01/chapter-16-2700149


Stationary and non-stationary Time Series
https://www.analyticsvidhya.com/blog/2015/12/complete-tutorial-time-series-modeling/


Metric graphs 101: Timeseries graphs: Representing Time Series
Line Graph, Bar Graph, Heatmap, Area Graph, Stacked Area Graphs
https://www.datadoghq.com/blog/timeseries-metric-graphs-101/


Stock Market Graphs
https://ca.finance.yahoo.com/quote/%5EGSPTSE?p=%5EGSPTSE&guccounter=1


Half Life
https://en.wikipedia.org/wiki/Exponential_decay#Half-life


Decomposing Time Series
https://otexts.com/fpp2/classical-decomposition.html


Decomposition of time series
https://en.wikipedia.org/wiki/Decomposition_of_time_series


Area Chart
https://en.wikipedia.org/wiki/Area_chart


Area Graph
https://datavizcatalogue.com/methods/area_graph.html

Represent Time Series with Heatmap
https://datavizcatalogue.com/methods/heatmap.html


Time Series Visualizations – An overview
http://complexdatavisualized.com/time-series-visualizations-an-overview/


Visualization: The Ebb and Flow of Movies: Box Office Receipts 1986 — 2008
http://archive.nytimes.com/www.nytimes.com/interactive/2008/02/23/movies/20080223_REVENUE_GRAPHIC.html

Why we need frequency domain?
https://math.stackexchange.com/questions/55310/why-we-need-frequency-domain


Time–frequency analysis for music signals
https://en.wikipedia.org/wiki/Time%E2%80%93frequency_analysis_for_music_signals


What is the difference between Time domain and frequency domain
https://www.researchgate.net/post/What_is_the_difference_between_Time_domain_and_frequency_domain10


Frequency Domain and Fourier Transforms
http://www.princeton.edu/~cuff/ele201/kulkarni_text/frequency.pdf


Moving Average (MA)
https://www.investopedia.com/terms/m/movingaverage.asp


Calculation of Trend by Moving Average Method
https://www.toppr.com/guides/business-mathematics-and-statistics/time-series-analysis/moving-average-method/


Basic Feature Engineering With Time Series Data in Python
https://machinelearningmastery.com/basic-feature-engineering-time-series-data-python/


Time Series Feature Extraction for industrial big data (IIoT) applications
https://towardsdatascience.com/time-series-feature-extraction-for-industrial-big-data-iiot-applications-5243c84aaf0e


Taxonomy of Time Series Forecasting Problems
https://machinelearningmastery.com/taxonomy-of-time-series-forecasting-problems/


How To Identify Patterns in Time Series Data: Time Series Analysis
http://www.statsoft.com/textbook/time-series-analysis


An Introduction to Stationary and Non-Stationary Processes
https://www.investopedia.com/articles/trading/07/stationary.asp


A Gentle Introduction to Handling a Non-Stationary Time Series in Python
https://www.analyticsvidhya.com/blog/2018/09/non-stationary-time-series-python/

Hierarchical Visualization: Examples, Implementations, Theory, and Projects

Hierarchical Visualization

Hierarchical Visualization in R
http://www.r-chart.com/2010/07/hierarchical-visualizations-in-r-and.html

Hierarchical cluster analysis on famous data sets – enhanced with the dendextend package
https://cran.r-project.org/web/packages/dendextend/vignettes/Cluster_Analysis.html

Tree Plots
https://plot.ly/python/tree-plots/

A Python framework for the analysis and visualization of trees.
http://etetoolkit.org/

Hierarchy
https://en.wikipedia.org/wiki/Hierarchy

Organizational Chart
https://upload.wikimedia.org/wikipedia/commons/8/86/Departments_in_advertising_agencies.jpg

Brackets
https://en.wikipedia.org/wiki/Bracket_(tournament)#/media/File:SixteenPlayerSingle

Introduction to Graphs
http://btechsmartclass.com/data_structures/introduction-to-graphs.html
https://www.csee.umbc.edu/courses/undergraduate/341/fall98/frey/ClassNotes/Class14/RootedTree.jpg

Tree Data Structure
https://en.wikipedia.org/wiki/Tree_(data_structure)

Unrooted Tree
https://image.slidesharecdn.com/phylogeneticanalysis-111117220939-phpapp01/95/phylogenetic-analysis-16-728.jpg?cb=1321568578

cyclicVSacyclic
http://www2.imm.dtu.dk/projects/graph/images/fig_graph_structures/cyclicVSacyclic.png

Querying Social Media with NodeXL
http://scalar.usc.edu/works/querying-social-media-with-nodexl/what-is-a-network-graph-what-is-a-node-link-diagram

Evaluation of Traditional, Orthogonal, and Radial Tree Diagrams by an Eye Tracking Study
http://www.joules.de/files/burch_evaluation_2011.pdf

Exponential SVG
https://upload.wikimedia.org/wikipedia/commons/thumb/6/64/Exponential.svg/718px-Exponential.svg.png

revisioning-trees
https://shapeofthought.typepad.com/shape_of_thought/revisioning-trees/

File System as Cone Trees
https://infovis-wiki.net/wiki/Cone_Trees

orthogonal_layouter
http://docs.yworks.com/yfiles/doc/developers-guide/orthogonal_layouter.html

Indented Tree or Graph
http://chisel.cs.uvic.ca/pubs/fu-ISWC2013.pdf
http://mbostock.github.io/protovis/ex/indent.html

Collapsible Indented Tree
https://bl.ocks.org/mbostock/1093025

Dendogram
https://en.wikipedia.org/wiki/Dendrogram

Visualizing Dendrograms in R
https://rpubs.com/gaston/dendrograms

Dendrograms in Python
https://plot.ly/python/dendrogram/

Hierarchical Clustering / Dendrograms
https://ncss-wpengine.netdna-ssl.com/wp-content/themes/ncss/pdf/Procedures/NCSS/Hierarchical_Clustering-Dendrograms.pdf

icicle
https://homes.cs.washington.edu/~jheer/files/zoo/ex/hierarchies/icicle.png

icicle in d3js
https://bl.ocks.org/mbostock/4347473

Radial Layout
https://yed.yworks.com/support/manual/layout/layout_radial.html

Thread Arcs
http://visualoop.com/media/2015/01/image_72.png

Trees and Graphs
https://courses.cs.washington.edu/courses/cse512/14wi/lectures/Trees&Graphs.pdf

Treemap Template
http://bl.ocks.org/ganeshv/6a8e9ada3ab7f2d88022

Nested Treemap
https://observablehq.com/@d3/nested-treemap

Ordered and Unordered Treemap Algorithms and Their Applications on Handheld Devices
https://www.nada.kth.se/utbildning/grukth/exjobb/rapportlistor/2005/rapporter05/engdahl_bjorn_05033.pdf

Circular Treemap
https://www.treemap.com/documentation/treemapping/circular-profit-sales.png

Voronoi treemaps
https://en.wikipedia.org/wiki/Voronoi_diagram
https://www.jasondavies.com/voronoi-treemap/

Visualizations
http://www.shengdongzhao.com/wp-content/uploads/2012/06/EH_InfoVis_Final1.ppt

Hyperbolic Trees
https://philogb.github.io/jit/static/v20/Jit/Examples/Hypertree/example1.html

Hyperbolic Space
http://karynvogel.blogspot.com/2012/01/hyperbolic-space.html
https://bakingandmath.com/2014/10/02/what-is-hyperbolic-space/

Hyperbolic Tree
https://en.wikipedia.org/wiki/Hyperbolic_tree

Sayed Ahmed

Linkedin: https://ca.linkedin.com/in/sayedjustetc

Blog: http://sitestree.com, http://bangla.salearningschool.com

Firewall, Security, and Misc

Nmap and Port Scanning

https://nmap.org/book/man-port-scanning-techniques.html

MacOs Commands:

nmap localhost

lsof -i :5955

MacOS Network Utility
https://wilsonmar.github.io/ports-open/

Port 49152
https://www.speedguide.net/port.php?port=49152

MacOs: Close the Ports and Firewall
https://www.macworld.com/article/1132558/connect2504.html

Did you every wonder why your product is not showing up in a category in Magento?

"

Magento 2 Product Visibility Grid

Did you every wonder why your product is not showing up in a category in Magento?

Magento has a complex way of building a product collection. Due to several conditions, indexes, plugins and other complexities determining whether a product should show is not that straightforward."

Details and Tools/Modules:
https://github.com/Itonomy/magento2-product-visibillitygrid

GEO VISUALIZATION: Data Visualization

GEO VISUALIZATION

spatial data

https://searchsqlserver.techtarget.com/definition/spatial-data

File:Latitude and Longitude of the Earth.svg

https://en.wikipedia.org/wiki/File:Latitude_and_Longitude_of_the_Earth.svg

Geographic coordinate system

https://en.wikipedia.org/wiki/GWhy are all world maps wrong?eographic_coordinate_system

How To Read GPS Coordinates

https://www.ubergizmo.com/how-to/read-gps-coordinates/

Geographic coordinate conversion

https://en.wikipedia.org/wiki/Geographic_coordinate_conversion

GPS coordinates converter

https://www.gps-coordinates.net/gps-coordinates-converter

GPS coordinates converter

https://www.gps-coordinates.net/gps-coordinates-converter

Map Projection

https://en.wikipedia.org/wiki/Map_projection

Why are all world maps wrong?

https://www.quora.com/Why-are-all-world-maps-wrong

Map Projections – types and distortion patterns

http://geokov.com/education/map-projection.aspx

Map Projection

https://en.wikipedia.org/wiki/Map_projection

Map projections and distortion

http://www.geography.hunter.cuny.edu/~jochen/GTECH361/lectures/lecture04/concepts/Map%20coordinate%20systems/Map%20projections%20and%20distortion.htm

Mercator’s Projection

http://www.math.ubc.ca/~israel/m103/mercator/mercator.html?utm_source=weibolife

https://en.wikipedia.org/wiki/Mercator_projection

https://www.britannica.com/science/Mercator-projection

MAPS, CHARTS, AND PROJECTIONS

http://www.tpub.com/timeconversion/15.htm

Understanding Map Projections

https://pdfs.semanticscholar.org/e844/813f5ec9665a9bce66eedd074430ee570471.pdf

Why Are Rhumb Lines (Loxodromes) a Constant Track Direction? (and not the Shortest Path)

https://gisgeography.com/rhumb-lines-loxodromes/

Kartography

http://cxhernandez.com/static/files/kartography/images/svg.png

ShapeFile and Data File

https://en.wikipedia.org/wiki/Shapefile

Geojson

http://geojson.io/#map=2/20.0/0.0

https://en.wikipedia.org/wiki/GeoJSON

Latlong-converter

https://www.directionsmag.com/site/latlong-converter/

Get Latitude and Longitude

https://www.latlong.net/

NETWORK VISUALIZATION : Data Visualization

NETWORK VISUALIZATION

Example:
http://graphs.grevian.org/resources/static/images/example1.png

Graph
http://mathworld.wolfram.com/Graph.html

DIRECTED, UNDIRECTED, WEIGHTED, UNWEIGHTED GRAPH REPRESENTATION IN ADJACENCY LIST, MATRIX REFERENCE SHEET
https://quickgrid.wordpress.com/2015/05/29/directed-undirected-weighted-unweighted-graph-representation-in-adjacency-list-matrix-reference-sheet/

Graphs in Computer Science
http://web.cecs.pdx.edu/~sheard/course/Cs163/Doc/Graphs.html

Types of Graphs
https://www.javatpoint.com/types-of-graphs

Finite State Machines
https://brilliant.org/wiki/finite-state-machines/

A D3 Network Graph
http://bl.ocks.org/jose187/4733747

Fisheye Distortion
https://bost.ocks.org/mike/fisheye/

http://www.michelecoscia.com/wp-content/uploads/2012/08/demon2.png

Arc Layout
http://bl.ocks.org/sjengle/5431779

Gridlayout
http://opentutorials.cgl.ucsf.edu/images/b/bc/GridLayout.png

Circular Layout
https://66.media.tumblr.com/8162e2b68064b3aff0fcc5f9be90c016/tumblr_inline_mtcb19aG1n1qzro4y.png

An A to Z of extra features for the D3 force layout
http://www.coppelia.io/2014/07/an-a-to-z-of-extra-features-for-the-d3-force-layout/

Force Layout
https://medium.com/@sxywu/understanding-the-force-ef1237017d5#.fo45j7vnp

Understanding D3.js Force Layout – 3: Seeing a Layout in Action
http://jsdatav.is/visuals.html?id=26648f33f3bc9725604a

Force-Directed Graph
https://observablehq.com/@d3/force-directed-graph

Hive Plot (Links)
https://bl.ocks.org/mbostock/2066415

Hive Plots
https://bost.ocks.org/mike/hive/

Exploratory Data Analysis of Network Traffic in Industrial Control Systems
http://docplayer.net/13892735-Exploratory-data-analysis-of-network-traffic-in-industrial-control-systems.html

Graph Theory – Isomorphism
https://www.tutorialspoint.com/graph_theory/graph_theory_isomorphism.htm

Planar graph
https://en.wikipedia.org/wiki/Planar_graph

Chord Dependency Diagram
https://observablehq.com/@d3/chord-dependency-diagram

Hierarchical Edge Bundling
https://observablehq.com/@d3/hierarchical-edge-bundling

Hierarchical Edge Bundles:Visualization of Adjacency Relations in Hierarchical Data
https://aviz.fr/wiki/uploads/Teaching2014/bundles_infovis.pdf

Data Visualization Misc

Data Visualization Overview:
—————————-

Data Visualization: About Data Visualization
http://guides.library.duke.edu/c.php?g=289678&p=1930713

I Can See Clearly Now: A Survey of Data Visualization Techniques & Practice
https://www.slideshare.net/myles_harrison/i-can-see-clearly-now-a-survey-of-data-visualization-techniques-practice-31179055

Visualization in Data Science: What is it for?
http://guides.library.duke.edu/c.php?g=289678&p=1930713

Anscombe’s quartet

https://en.wikipedia.org/wiki/Anscombe’s_quartet

Storytelling and data visualization… So what?
https://www.dapresy.com/storytelling-and-data-visualization/

Visualization Types

https://guides.library.duke.edu/datavis/vis_types

Junk Charts

https://junkcharts.typepad.com/junk_charts/2012/10/expanding-circles-of-error.html

Visualization Analysis & Design

https://www.cs.ubc.ca/~tmm/talks/minicourse14/vad16nasa.pdf


Python Treemaps with Squarify & Matplotlib
Treemaps With Squarify

https://fcpython.com/visualisation/python-treemaps-squarify-matplotlib


200 Basic Treemap with python
HIERARCHICAL CLUSTERING IN R: THE ESSENTIALS
Geographic Data with Basemap
Plotting data on a map (Example Gallery)
https://matplotlib.org/basemap/users/examples.html

https://gist.github.com/blaylockbk/79658bdde8c1334ab88d3a67c6e57477
Introduction to Interactive Time Series Visualizations with Plotly in Python

Time Series Data Visualization with Python

Introduction to Data Visualization in Python
https://towardsdatascience.com/introduction-to-data-visualization-in-python-89a54c97fbed

https://guides.library.duke.edu/c.php?g=289678&p=1930713

http://cds.nyu.edu/wpcontent/uploads/2014/04/bertini_datascience_showcase_May12_2014.pdf
https://en.wikipedia.org/wiki/Anscombe’s_quartet

DATA VISUALIZATION VS. INFOGRAPHICS

https://visage.co/throwdown-data-visualization-vs-infographics/

https://galaxydatatech.com/2018/03/20/treemaps-with-squarify/

https://python-graph-gallery.com/200-basic-treemap-with-python/

Dendrograms in Python

https://plot.ly/python/dendrogram/

https://python-graph-gallery.com/dendrogram/

https://www.datanovia.com/en/lessons/examples-of-dendrograms-visualization/

https://jakevdp.github.io/PythonDataScienceHandbook/04.13-geographic-data-with-basemap.html

A quick demonstration of creating a basemap and plotting or drawing objects

https://towardsdatascience.com/introduction-to-interactive-time-series-visualizations-with-plotly-in-python-d3219eb7a7af

https://machinelearningmastery.com/time-series-data-visualization-with-python/

Data Visualization: BASIC CHARTS : Resources:

BASIC CHARTS

Types: Datasets and Data
http://www.cs.ubc.ca/~tmm/talks/minicourse14/vad16nasa.pdf

Common Charts
Histogram: https://en.wikipedia.org/wiki/Histogram
Histogram Examples: https://statistics.laerd.com/statisticalguides/understanding-histograms.php

The problem with Sturges’ rule for constructing histograms
https://robjhyndman.com/papers/sturges.pdf

Bad examples for Histogram: https://www2.southeastern.edu/Academics/Faculty/dgurney/Math241/StatTopics/HistGen.htm

Histogram (Non-Uniform Widths)
https://www.onlinemathlearning.com/histogram-width.html

What Is a Frequency Polygon Used For?
https://www.reference.com/math/frequency-polygon-used-54f72d4d24e0666c

Histograms and histographs
https://www150.statcan.gc.ca/n1/edu/power-pouvoir/ch9/histo/5214822-eng.htm

Frequency Polygon
http://www.matematikaria.com/kamus/frequency-polygon.html

Bar Chart

Chart
https://en.wikipedia.org/wiki/Chart#/media/File:F%C3%B6rs%C3%A4ljningsstatisti%20k_f%C3%B6r_blanddrycker.png

https://en.wikipedia.org/wiki/Chart

Bar Chart: Construction
https://www.slideshare.net/infinityrulz/stats-16

Survey:
https://www.slideshare.net/myles_harrison/i-can-see-clearly-now-a-survey-of-data-visualization-techniques-practice-31179055
https://www.slideshare.net/infinityrulz/stats-16

Piechart
https://en.wikipedia.org/wiki/File:ActionnariatLibe2007-fr.svg

http://fluidsurveys.com/university/use-different-chart-types/

Construction of Pie Charts
https://www.math-only-math.com/construction-of-pie-chart.html

Serviceability Reports Archive
https://www.cisco.com/en/US/docs/voice_ip_comm/cucm/service/4_0_1/ccmsrvs/sssrvrep.html

Understanding Pie Charts: Good and bad Examples
https://eagereyes.org/techniques/pie-charts

Box Plot
https://en.wikipedia.org/wiki/Box_plot

How to Read and Use a Box-and-Whisker Plot
https://flowingdata.com/2008/02/15/how-to-read-and-use-a-box-and-whisker-plot/

Boxplot
http://shiny.chemgrid.org/boxplotr/

How to Think Outside the Boxplot
https://blog.minitab.com/blog/statistics-and-quality-data-analysis/how-to-think-outside-the-boxplot