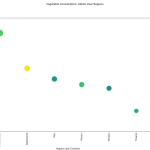
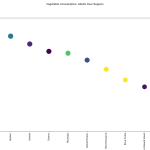
Jun 24
Web Control Panels : Cloud Server Management/Control Panels
2019’s Ultimate Guide to Web Panels: cPanel vs. Plesk vs. Webmin vs. Other Popular Hosting Management Tools
https://www.hostingadvice.com/blog/cpanel-vs-plesk-vs-webpanel/
—
How to enable/disable PHP extensions in Plesk interface?
https://support.plesk.com/hc/en-us/articles/115001377534-How-to-enable-disable-PHP-extensions-in-Plesk-interface-
—
If the above does not work? or if you are not using Plesk
How to Setup ionCube Loader on CentOS 7
https://www.vultr.com/docs/how-to-setup-ioncube-loader-on-centos-7
—
Install Plesk on CentOS 7
https://www.vultr.com/docs/install-plesk-on-centos-7
—
You might find options to deploy a Cloud Instance with Plesk App from GUI.
Else, you can install with Linux commands as above
—
Is Webmin good to manage data centers? Note: Cpanel, WHM, and Plesk to my experience are way more popular.
https://www.techrepublic.com/article/webmin-one-big-drawback-to-using-this-data-center-management-tool/
However, the best option to manage Linux boxes are using CLI (Command line). Cpanel, WHM, Plesk, Webmin, or similar can be easy and work in smaller contexts. Using CLI (command) is the way to go. Using Docker/Ansible/Puphet/Chef or similar is kind of must when managing 100s or 1000s of servers.
—
The MaRS Health ecosystem :
https://www.marsdd.com/our-sectors/health/
—
ABOUT DOT HEALTH
Headquarters: Toronto.
In business since: February of 2017.
Employees: 20.
Revenue: Not available.
—
Sayed Ahmed
Linkedin: https://ca.linkedin.com/in/sayedjustetc
Blog: http://sitestree.com, http://bangla.salearningschool.com
Jun 23
Product funding and the burden of agility
https://www.cio.com/article/3404456/product-funding-and-the-burden-of-agility.html
—
3 fundamentals for supercharging your data strategy
https://www.cio.com/article/3402319/3-fundamentals-for-supercharging-your-data-strategy.html
—
AI helps Land O’ Lakes churn data into sales
https://www.cio.com/article/3402736/ai-helps-land-o-lakes-churn-data-into-sales.html
—
4 hot digital transformation trends — and 4 going cold
https://www.cio.com/article/3256045/digital-transformation-trends.html
—
5 enterprise cloud strategy trends for 2019
https://www.cio.com/article/3137946/6-trends-that-will-shape-cloud-computing-in-2017.html
—
IT ROI: 10 tips for selling (and proving) the value of IT
https://www.cio.com/article/3403380/10-tips-for-selling-and-proving-its-roi.html
—
9 dark secrets of low-code software development
https://www.cio.com/article/3402717/9-dark-secrets-of-low-code-software-development.html?upd=1561295898753
—
Sayed Ahmed
Linkedin: https://ca.linkedin.com/in/sayedjustetc
Blog: http://sitestree.com, http://bangla.salearningschool.com
Jun 22
Machine Learning: Apply PCA on Datasets and Related
FactorAnalyzer
https://github.com/EducationalTestingService/factor_analyzer
—
sruti-jain/Marketing-Analysis-for-Hotel-Chain-website
https://github.com/sruti-jain/Marketing-Analysis-for-Hotel-Chain-website
—
Understanding PCA (Principal Component Analysis) with Python
https://towardsdatascience.com/dive-into-pca-principal-component-analysis-with-python-43ded13ead21
The code for the most part will work though it used an earlier version of Python
You will need module: StandardScaler
Otherwise you might find the code below to be useful:
[# ref: https://python-for-multivariate-analysis.readthedocs.io/a_little_book_of_python_for_multivariate_analysis.html]
import sklearn
from sklearn import preprocessing
standardisedX = sklearn.preprocessing.scale(cancer.data)
standardisedX = pd.DataFrame(standardisedX) #, index=cancer.data.index, columns=cancer.data.columns)
standardisedX.apply(np.mean)
X_scaled = standardisedX
from sklearn import decomposition
pca = decomposition.PCA(n_components=3).fit(standardisedX)
pca = decomposition.PCA(n_components=3).fit_transform(standardisedX)
X_pca = pca
ex_variance=np.var(X_pca,axis=0)
ex_variance_ratio = ex_variance/np.sum(ex_variance)
ex_variance_ratio
Xax=X_pca[:,0]
Yax=X_pca[:,1]
labels=cancer.target
cdict={0:’red’,1:’green’}
labl={0:’Malignant’,1:’Benign’}
marker={0:’*’,1:’o’}
alpha={0:.3, 1:.5}
fig,ax=plt.subplots(figsize=(7,5))
fig.patch.set_facecolor(‘white’)
for l in np.unique(labels):
ix=np.where(labels==l)
ax.scatter(Xax[ix],Yax[ix],c=cdict[l],s=40,
label=labl[l],marker=marker[l],alpha=alpha[l])
# for loop ends
plt.xlabel("First Principal Component",fontsize=14)
plt.ylabel("Second Principal Component",fontsize=14)
plt.legend()
plt.show()
Sayed Ahmed
Linkedin: https://ca.linkedin.com/in/sayedjustetc
Blog: http://sitestree.com, http://bangla.salearningschool.com
Jun 21
What if You Commit Files with Sensitive Information to GitHUB/BitBucket
http://sitestree.com/what-if-you-commit-files-with-sensitive-information-to-githubbitbucket/
Git basic commands and basic branching with Github
Tools: Version Control, Version Management and GIT
http://sitestree.com/version-control-version-management-and-git/
You can use Gitlab internally (i.e. install in your corporation) . It will act as a version control server. Gitlab is Linux/Unix specific. Gitlab is written in Ruby.
You can also use Github, however, to keep your projects private, you will need to pay (in recent times, this might have been made free). BitBucket is an alternative to Github, the advantage is, you can keep your projects private as long as the number of users is less than or equal to five.
Linux OS usually comes with several Git clients both graphical and command line to interact with Git servers.
Some others: Bonobo Git Server, Gitbilt, and BitBucket.
Gitlab
"Gitlab is a free git repository management application based on Ruby on Rails. It is distributed under the MIT License and its source code can be found on Github. It is a very active project with a monthly release cycle and ideal for businesses that want to keep their code private."
https://wiki.archlinux.org/index.php/gitlab
Official Gitlab site: https://about.gitlab.com/
"Open source software to collaborate on code
GitLab offers git repository management, code reviews, issue tracking, activity feeds and wikis. Enterprises install GitLab on-premise and connect it with LDAP and Active Directory servers for secure authentication and authorization. A single GitLab server can handle more than 25,000 users but it is also possible to create a high availability setup with multiple active servers." from https://about.gitlab.com/
Recommended Git Client/User side Tools
SmartGit
RabbitVCS
Some Git tools
gitk – graphical history browser, in Tcl/Tk, distributed with Git (usually in gitk package)
git gui – graphical commit tool, in Tcl/Tk, distributed with Git (usually in git-gui package)
QGit – uses Qt toolkit
Giggle – uses GTK+ toolkit
git-cola – uses PyQt4
gitg – GTK+/GNOME clone of GitX
tig – text mode interface for git, is GUI and pager, uses ncurses
SmartGit
gitg
rabbitVCS
Reference: http://askubuntu.com/questions/227554/best-gui-client-for-git
Git Server for Windows
Bonobo Git Server, it is designed to run on Windows in IIS
You can try Git Candy, A Git platform based on ASP.NET MVC.
Source on http://github.com/Aimeast/GitCandy
Demo on http://gitcandy.com/
Gitlab Alternatives
http://alternativeto.net/software/gitlab/?platform=windows
S. Ahmed
Linkedin: https://ca.linkedin.com/in/sayedjustetc
Blog: http://sitestree.com, http://bangla.salearningschool.com
Jun 19
How to Interpret your Regression Results
Goal: How to Identify the Most Important Predictor Variables in Regression Models
https://blog.minitab.com/blog/adventures-in-statistics-2/how-to-identify-the-most-important-predictor-variables-in-regression-models
—
—
How to Interpret Regression Analysis Results: P-values and Coefficients
https://blog.minitab.com/blog/adventures-in-statistics-2/how-to-interpret-regression-analysis-results-p-values-and-coefficients
—
Regression Analysis: How to Interpret the Constant (Y Intercept)
https://blog.minitab.com/blog/adventures-in-statistics-2/regression-analysis-how-to-interpret-the-constant-y-intercept
—
How to Compare Regression Slopes: How to statistically test the difference between regression slopes and constants
https://blog.minitab.com/blog/adventures-in-statistics-2/how-to-compare-regression-lines-between-different-models
—
How Do I Interpret R-squared and Assess the Goodness-of-Fit?
https://blog.minitab.com/blog/adventures-in-statistics-2/regression-analysis-how-do-i-interpret-r-squared-and-assess-the-goodness-of-fit
—
How High Should R-squared Be in Regression Analysis?
https://blog.minitab.com/blog/adventures-in-statistics-2/how-high-should-r-squared-be-in-regression-analysis
—
How to Interpret a Regression Model with Low R-squared and Low P values
https://blog.minitab.com/blog/adventures-in-statistics-2/how-to-interpret-a-regression-model-with-low-r-squared-and-low-p-values
—
Use Adjusted R-Squared and Predicted R-Squared to Include the Correct Number of Variables
https://blog.minitab.com/blog/adventures-in-statistics-2/multiple-regession-analysis-use-adjusted-r-squared-and-predicted-r-squared-to-include-the-correct-number-of-variables
—
How to Interpret S, the Standard Error of the Regression
https://blog.minitab.com/blog/adventures-in-statistics-2/regression-analysis-how-to-interpret-s-the-standard-error-of-the-regression
—
What Is the F-test of Overall Significance in Regression Analysis?
https://blog.minitab.com/blog/adventures-in-statistics-2/what-is-the-f-test-of-overall-significance-in-regression-analysis
—
Understanding Analysis of Variance (ANOVA) and the F-test
https://blog.minitab.com/blog/adventures-in-statistics-2/understanding-analysis-of-variance-anova-and-the-f-test
—
How to Compare Regression Slopes
https://blog.minitab.com/blog/adventures-in-statistics-2/how-to-compare-regression-lines-between-different-models
—
How to Present and Use the Results to Avoid Costly Mistakes, part 1
https://blog.minitab.com/blog/adventures-in-statistics-2/applied-regression-analysis-how-to-present-and-use-the-results-to-avoid-costly-mistakes-part-1
—
How to Identify the Most Important Predictor Variables in Regression Models
https://blog.minitab.com/blog/adventures-in-statistics-2/how-to-identify-the-most-important-predictor-variables-in-regression-models
—
Linkedin: https://ca.linkedin.com/in/sayedjustetc
Blog: http://sitestree.com, http://bangla.salearningschool.com
Jun 19
Tools : Regression: Data Science and Analytics:
Online Multiple Linear Regression
http://www.xuru.org/rt/mlr.asp
—
How to Identify the Most Important Predictor Variables in Regression Models
https://blog.minitab.com/blog/adventures-in-statistics-2/how-to-identify-the-most-important-predictor-variables-in-regression-models
—
How to Interpret Regression Analysis Results: P-values and Coefficients
https://blog.minitab.com/blog/adventures-in-statistics-2/how-to-interpret-regression-analysis-results-p-values-and-coefficients
—
Why You Need to Check Your Residual Plots for Regression Analysis: Or, To Err is Human, To Err Randomly is Statistically Divine
https://blog.minitab.com/blog/adventures-in-statistics-2/why-you-need-to-check-your-residual-plots-for-regression-analysis
—
Multiple Linear Regressions Analysis
Good Part: You can do Residual Analysis
Cons: only 4 variables, and have to enter data manually
http://home.ubalt.edu/ntsbarsh/business-stat/otherapplets/MultRgression.htm
—
Minitab provides the tools you need to analyze data and find meaningful solutions to your toughest business problems.
http://www.minitab.com/en-us/products/minitab/
—
Doing in Excel
http://www.real-statistics.com/multiple-regression/multiple-regression-analysis/multiple-regression-analysis-excel/
—
Multiple Regression Analysis
http://www.real-statistics.com/multiple-regression/multiple-regression-analysis/
—
"Stata is the solution for your data science needs. Obtain and manipulate data. Explore. Visualize. Model. Make inferences. Collect your results into reproducible reports."
https://www.stata.com/
—
Sure, you can write Python/R code or Use SPSS, SAS, Matlab or similar
EXCEL: Access and Activating the Data Analysis Toolpack
http://cameron.econ.ucdavis.edu/excel/ex01access.html
—
"Control your data, extend your reach, improve your processes, grow your revenue"
http://www.statgraphics.com/
—
"Statistix 10Data analysis software for researchers"
https://www.statistix.com/
—
SYSTAT 13.2 – Powerful Statistical Analysis and Graphics Software
https://systatsoftware.com/products/systat/
—
Global No.1 Business Data Platform
https://www.statista.com/
—
Sayed Ahmed
Linkedin: https://ca.linkedin.com/in/sayedjustetc
Blog: http://sitestree.com, http://bangla.salearningschool.com
Jun 19
Can GPS ‘Spoofing’ Send Your Car Into a Tree?
—
Trump Moves From Trade War Toward Currency War
—
American Air Orders 50 of Airbus’s Longest-Range A321 Aircraft
—
U.S. Navy Presents Evidence of Iran’s Role in Attack on Tankers
—
Sayed Ahmed
Linkedin: https://ca.linkedin.com/in/sayedjustetc
Blog: http://sitestree.com, http://bangla.salearningschool.com
Jun 17
Next Recession: How to Invest and Profit in the Next Recession
How to Invest and Profit in the Next Recession
https://www.bloomberg.com/opinion/articles/2019-06-17/how-to-invest-and-profit-in-the-next-recession
"
plan on deploying your cash in tranches: Buy a U.S. index fund when markets are down 20 to 25%; add a developed global index fund when markets fall by 30%. And if we are lucky enough to enjoy a 35 to 40% decline (that’s assuming you prepared for this moment), buy emerging-market stocks.
"
—-
Data Science, Analytics, and Prediction: Basic Knowledge:
https://www.kaggle.com/etakla/exploring-the-dataset-univariate-analysis
https://www.kaggle.com/etakla/exploring-the-dataset-bivariate-analysis
https://towardsdatascience.com/survival-analysis-part-a-70213df21c2e
https://lifelines.readthedocs.io/en/latest/
https://lifelines.readthedocs.io/en/latest/Survival%20Regression.html
https://www.statsdirect.com/help/survival_analysis/cox_regression.htm
https://courses.lumenlearning.com/suny-natural-resources-biometrics/chapter/chapter-7-correlation-and-simple-linear-regression/
https://www.kaggle.com/residentmario/univariate-plotting-with-pandas
https://scikit-learn.org/stable/auto_examples/linear_model/plot_ols.html
https://www.shanelynn.ie/using-pandas-dataframe-creating-editing-viewing-data-in-python/
https://www.pearsonhighered.com/gould-statistics-2e-info/assets/pdf/sample-chapter-ess-ch04.pdf
https://www.kaggle.com/amanajmera1/linear-regression-model-on-nba-dataset
https://www.oreilly.com/library/view/practical-statistics-for/9781491952955/ch04.html
http://sites.utexas.edu/sos/guided/inferential/numeric/bivariate/cor/
https://www.graphpad.com/support/faq/what-is-the-difference-between-correlation-and-linear-regression/
https://www.statsdirect.com/help/regression_and_correlation/simple_linear.htm
https://erc.barnard.edu/spss/pearsons_r
https://www.statpac.com/statistics-calculator/correlation-regression.htm
https://www.statisticssolutions.com/correlation-pearson-kendall-spearman/
https://www.bmj.com/about-bmj/resources-readers/publications/statistics-square-one/11-correlation-and-regression
https://www.statisticssolutions.com/bivariate-correlation/
https://data-flair.training/blogs/python-statistics/
https://www.kaggle.com/naina04/bivariate-plotting-with-pandas
https://www.analyticsvidhya.com/blog/2016/01/guide-data-exploration/
https://www.kaggle.com/residentmario/univariate-plotting-with-pandas
Sayed Ahmed
Linkedin: https://ca.linkedin.com/in/sayedjustetc
Blog: http://sitestree.com, http://bangla.salearningschool.com
Jun 15
SQL Server (SSAS): Data Mining: Data Science: Data Analytics: Prediction: Neural Networks : Linear/Logistics Regression
SQL Server Analysis Service:
Data Mining Algorithms (Analysis Services – Data Mining)
https://docs.microsoft.com/en-us/sql/analysis-services/data-mining/data-mining-algorithms-analysis-services-data-mining?view=sql-server-2017
—
Microsoft Association Algorithm
https://docs.microsoft.com/en-us/sql/analysis-services/data-mining/microsoft-association-algorithm?view=sql-server-2017
—
Association Model Query Examples
https://docs.microsoft.com/en-us/sql/analysis-services/data-mining/association-model-query-examples?view=sql-server-2017
—
Microsoft Clustering Algorithm
https://docs.microsoft.com/en-us/sql/analysis-services/data-mining/microsoft-clustering-algorithm?view=sql-server-2017
Clustering Model Query Examples
https://docs.microsoft.com/en-us/sql/analysis-services/data-mining/clustering-model-query-examples?view=sql-server-2017
—
Microsoft Time Series Algorithm
https://docs.microsoft.com/en-us/sql/analysis-services/data-mining/microsoft-time-series-algorithm?view=sql-server-2017
—
Time Series Model Query Examples
https://docs.microsoft.com/en-us/sql/analysis-services/data-mining/time-series-model-query-examples?view=sql-server-2017
—
Microsoft Neural Network Algorithm
https://docs.microsoft.com/en-us/sql/analysis-services/data-mining/microsoft-neural-network-algorithm?view=sql-server-2017
—
Neural Network Model Query Examples
https://docs.microsoft.com/en-us/sql/analysis-services/data-mining/neural-network-model-query-examples?view=sql-server-2017
—
Microsoft Naive Bayes Algorithm
https://docs.microsoft.com/en-us/sql/analysis-services/data-mining/microsoft-naive-bayes-algorithm?view=sql-server-2017
—
Microsoft Logistic Regression Algorithm
https://docs.microsoft.com/en-us/sql/analysis-services/data-mining/microsoft-logistic-regression-algorithm?view=sql-server-2017
—
Logistic Regression Model Query Examples
https://docs.microsoft.com/en-us/sql/analysis-services/data-mining/logistic-regression-model-query-examples?view=sql-server-2017
—
Statistics in SQL: Simple Linear Regressions
"
Statistics in SQL: Pearson’s Correlation
Statistics in SQL: Kendall’s Tau Rank Correlation
Statistics in SQL: Simple Linear Regressions
Statistics in SQL: The Kruskal–Wallis Test
Statistics in SQL: The Mann–Whitney U Test
Statistics in SQL: Student’s T Test
"
https://www.red-gate.com/simple-talk/blogs/statistics-sql-simple-linear-regressions/
—
Linear Regression Model Query Examples
"Sample Query 1: Using the Data Mining Schema Rowset to Determine Parameters Used for a Model
Sample Query 2: Retrieving the Regression Formula for the Model
Sample Query 3: Returning Only the Coefficient for the Model
Sample Query 4: Predicting Income using a Singleton Query
Sample Query 5: Using Prediction Functions with a Regression Model"
Prediction Functions:
"
Prediction Function Usage
IsDescendant (DMX) Determines whether one node is a child of another node in the model.
IsInNode (DMX) Indicates whether the specified node contains the current case.
PredictHistogram (DMX) Returns a predicted value, or set of values, for a specified column.
PredictNodeId (DMX) Returns the Node_ID for each case.
PredictStdev (DMX) Returns standard deviation for the predicted value.
PredictSupport (DMX) Returns the support value for a specified state.
PredictVariance (DMX) Returns the variance of a specified column.
Microsoft Linear Regression Algorithm
https://docs.microsoft.com/en-us/sql/analysis-services/data-mining/microsoft-linear-regression-algorithm?view=sql-server-2017
—
Microsoft R
https://mran.microsoft.com/spotlightarchive
—
Decision Trees Model Query Examples
Sample Query 3: Retrieving Subtrees from the Model
Making Predictions using a Decision Trees Model
Sample Query 4: Returning Predictions with Probabilities
Sample Query 5: Predicting Associations from a Decision Trees Model
Sample Query 6: Retrieving a Regression Formula from a Decision Trees Model
Sayed Ahmed
Linkedin: https://ca.linkedin.com/in/sayedjustetc
Blog: http://sitestree.com, http://bangla.salearningschool.com