Part 2: Some basic Math/Statistics concepts that Data Scientists (the true ones) will usually know/use (came across, studied, learned, used)
Covariance and Correlation
"Covariance is a measure of how two variables change together, but its magnitude is unbounded, so it is difficult to interpret. By dividing covariance by the product of the two standard deviations, one can calculate the normalized version of the statistic. This is the correlation coefficient." https://www.investopedia.com/terms/c/correlationcoefficient.asp on Investing and Covariance/Correlation
Covariance and expected value
"Covariance is calculated as expected value or average of the product of the differences of each random variable from their expected values, where E[X] is the expected value for X and E[Y] is the expected value of y."
cov(X, Y) = E[(X - E[X]) . (Y - E[Y])]
cov(X, Y) = sum (x - E[X]) * (y - E[Y]) * 1/n
Sample: covariance: cov(X, Y) = sum (x - E[X]) * (y - E[Y]) * 1/(n - 1)
Ref: https://machinelearningmastery.com/introduction-to-expected-value-variance-and-covariance/
Formula for continuous variables
where ![]() is the joint probability density function of
is the joint probability density function of ![]() and
and ![]() .
.
Formula for Discrete Variables
![[eq1]](https://i0.wp.com/www.statlect.com/images/covariance-formula__3.png?w=474&ssl=1)
Reference: https://www.statlect.com/glossary/covariance-formula
Correlation:
What is Correlation?
"Correlation, in the finance and investment industries, is a statistic that measures the degree to which two securities move in relation to each other. Correlations are used in advanced portfolio management, computed as the correlation coefficient, which has a value that must fall between -1.0 and +1.0." Ref: https://www.investopedia.com/terms/c/correlation.asp
Correlation formula:
Ref: http://www.stat.yale.edu/Courses/1997-98/101/correl.htm
Correlation in Linear Regression:
"The square of the correlation coefficient, r², is a useful value in linear regression. This value represents the fraction of the variation in one variable that may be explained by the other variable. Thus, if a correlation of 0.8 is observed between two variables (say, height and weight, for example), then a linear regression model attempting to explain either variable in terms of the other variable will account for 64% of the variability in the data."
http://www.stat.yale.edu/Courses/1997-98/101/correl.htm
http://sphweb.bumc.bu.edu/otlt/MPH-Modules/BS/BS704_Multivariable/BS704_Multivariable5.html
Ref: http://ci.columbia.edu/ci/premba_test/c0331/s7/s7_5.html
Independent Events
"In probability, two events are independent if the incidence of one event does not affect the probability of the other event. If the incidence of one event does affect the probability of the other event, then the events are dependent."
Ref: https://brilliant.org/wiki/probability-independent-events/
How do you know if an event is independent?
"To test whether two events A and B are independent, calculate P(A), P(B), and P(A ∩ B), and then check whether P(A ∩ B) equals P(A)P(B). If they are equal, A and B are independent; if not, they are dependent. 1. You throw two fair dice, one green and one red, and observe the numbers uppermost."
Ref: https://www.zweigmedia.com/RealWorld/tutorialsf15e/frames7_5C.html
With Examples: https://www.mathsisfun.com/data/probability-events-independent.html
Joint Distributions and Independence
The joint PMF of X1X1, X2X2, ⋯⋯, XnXn is defined asPX1,X2,...,Xn(x1,x2,...,xn)=P(X1=x1,X2=x2,...,Xn=xn).
For continuous case:
P((X1,X2,⋯,Xn)∈A)=∫⋯∫A⋯∫fX1X2⋯Xn(x1,x2,⋯,xn)dx1dx2⋯dxn.
marginal PDF of XiXi
fX1(x1)=∫∞−∞⋯∫∞−∞fX1X2...Xn(x1,x2,...,xn)dx2⋯dxn.
Ref: https://www.probabilitycourse.com/chapter6/6_1_1_joint_distributions_independence.php
Random Vectors, Random Matrices, and Their Expected Values
http://www.statpower.net/Content/313/Lecture%20Notes/MatrixExpectedValue.pdf
Random Variables and Probability Distributions: https://www.stat.pitt.edu/stoffer/tsa4/intro_prob.pdf
What are moments of a random variable?
"The “moments” of a random variable (or of its distribution) are expected values of powers or related functions of the random variable. The rth moment of X is E(Xr). In particular, the first moment is the mean, µX = E(X). The mean is a measure of the “center” or “location” of a distribution. Ref: http://homepages.gac.edu/~holte/courses/mcs341/fall10/documents/sect3-3a.pdf"
Characteristic function (probability theory)
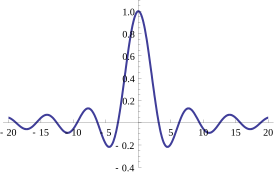
Jump to navigationJump to search The characteristic function of a uniform U(–1,1) random variable. This function is real-valued because it corresponds to a random variable that is symmetric around the origin; however characteristic functions may generally be complex-valued.
"In probability theory and statistics, the characteristic function of any real-valued random variable completely defines its probability distribution. If a random variable admits a probability density function, then the characteristic function is the Fourier transform of the probability density function."
Ref: https://en.wikipedia.org/wiki/Characteristic_function_(probability_theory)
Functions of random vectors and their distribution
https://www.statlect.com/fundamentals-of-probability/functions-of-random-vectors
![[eq4]](https://i0.wp.com/www.statlect.com/images/covariance-formula__11.png?w=474&ssl=1)


